The intention of this study was to produce a good quality, high-resolution data basis for the catchment area of the River Rhine in order to perform hydrological investigations. The area of investigation ranges from Lake Constance to the Dutch-German border. The data basis for the investigation was the time series of the water level and the runoff time series at gauges of the river Rhine and its tributary rivers with a resolution of ΔT=1h. Further information on the gauges (such as discharge tables, discharge measurement and possibly further time series e.g. eta values) were also taken into consideration.
The gauges to be considered were defined in common agreement with the steering group. The underlying data were provided by the individual operators of the gauges and were reviewed for plausibility and homogeneity. The degree of detail for further metadata varied and it was not always possible to gather all the required information. Sometimes, several data supplies with different contents were delivered. It is very important that the individual opera-tors are aware of the importance of consistent and complete data management.
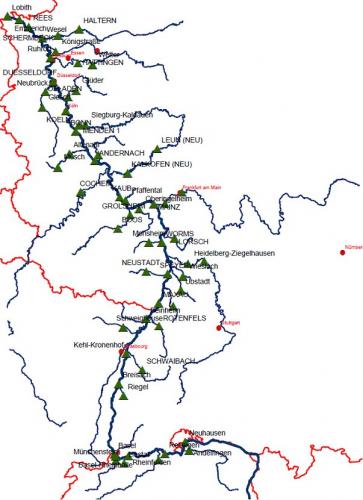
Overview map of gauges and rivers
The first step was to evaluate and compare the average values of the Rhine gauges. In this process, we were already able to identify two areas in which the gauges are not in balance with the delivered runoff time series. Those areas were the area Breisach/Kehl-Kronenhof and the Lower Rhine. The overview of all other sections of the Rhine seemed plausible. The underlying principle of the examination and especially the possible amelioration and adjustment of the runoff time series is, if required, not to adapt the runoff time series themselves but the underlying data. It is only possible to achieve a detailed balance for homogenous datasets when the underlying data are resilient and practically fault-proof. Therefore, possible modifications have to be performed on the runoff time series themselves, as well as on the discharge measurements and the discharge tables. Thus, an exact examination of the underlying data is required.
The runoff time series were checked for plausibility and homogeneity and were adapted, if required. It was also possible to examine the individual discharge measurements for plausibility and for homogeneity. There was, however, no real controlling or calculation review of the individual measurements. The main focus was on the examination of the discharge tables. A detailed comparison between the discharge measurements, the discharge tables and the respective validities was performed on all main gauges. Furthermore, discharges of main gauges that could not be determined using simple discharge tables from water levels were examined by comparison with the measurements (partly using different techniques). During this process, some gauges of which the discharges could be improved were determined. Those gauges were edited accordingly when balance problems were detected. An adaptation however, was not possible for some gauges, as the required basis data were not available (missing measurements, discharges that derived from power plant data...)
After analysing the underlying data, especially after analysing the discharge tables, a total balance was created for the examined sector of the Rhine. In this process, the difference of the inflowing and the flowing-off rate of water was generated for each sector between the gauges of the Rhine for the entire examination period. As not the entire intermediate sector is covered by gauges, the discharge rate was determined by hydrological factors. In an initial approach, those hydrological factors were determined according to the size of the catchment area. Based on this, the total balance shows that, as a general rule, too much water flows out of the intermediate areas and into the system. The second step was the determination of optimised hydrological factors. Thereby, not only the size of the catchment area, but also the spatial variability was taken into consideration. Based on that, the total balance shows significant improvements; large areas of the river Rhine showed a remarkable balance. Only the areas Breisach, Kehl-Kronenhof and the Lower Rhine still show significant "inconsistencies" in their balance.
For the total balance, the average discharges resp. the total discharge rate was observed for the entire examination period. Temporary deviations that may even offset each other are not apparent in this examination. As part of the subsequent detailed balance, the temporal variance of the balances was analysed and possible improvements were performed. For this purpose, the time course of the difference time series and the summarised differences were examined; individual balance sections show significant problems. Provided the underlying data allowed a data-based adaptation of the discharge time series, these were recalculated with newly created discharge tables, for example. Next, the effect was examined in a renewed detailed balance and, if required, further adaptations were performed using iterative procedures. It was partly not possible to adapt the discharges as no appropriate underlying data are present (e.g. missing information from the power plant operators, insufficient discharge measurements...). Especially for the gauges Breisach and Kehl-Kronenhof, it was impossible to create appropriate discharge time series. However, after implementing the adaptation, all other balance areas reveal the best possible balance, showing deviations substantially lower than 1%.
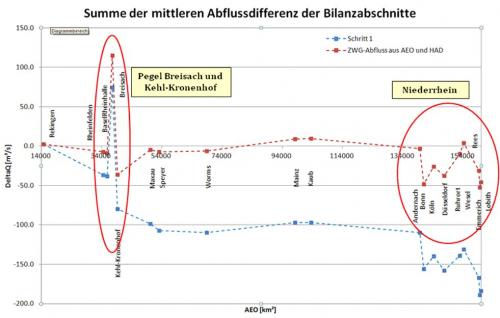
Cumulated mean discharge differences for the water balance with original data
In order to make a conclusion about the purity of the balance of the individual balance sectors in the high run-off area, the average and the low run-off area, a spectrum balance was determined for the individual balance sectors. During this process, the analysis of the balance purity is performed based on the respective discharge level.
As part of a closing general assessment of the sensitivity of the individual components to the balance, it was found that some of the individual components, that were relevant for the assessment of the discharges and, therefore, for the balances, revealed significant uncertainties. Random uncertainties that occur e.g. during discharge measurements, can only be compensated through numerous measurements. Systematic "errors" that are usually not taken into consideration, can be expected due to hysteresis, evaporation and leaching.
An enhancement of the procedure for the discharge measurement considering the effects of hysteresis was shown and conducted exemplarily. The systematic application of this procedure indicates that an improvement of the discharge balances can be expected. Besides the "common" evaluations, that only use the data of the gauge observed individually, it seems reasonable to develop a spatially enhanced discharge measurement also considering the gauges in the neighbourhood. Therefore however, further target-oriented examinations, method development and their examination/application are required.
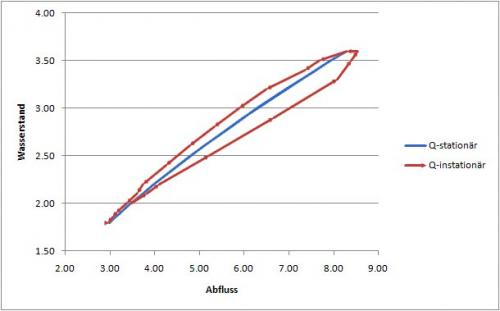
Schematic presentation of the stage-discharge-relation for a flood wave in case of stationair flow conditions
Following the examinations, discharge time series of high resolution are available for the examined Rhine Basin, except for the areas of Breisach and Kehl-Kronenhof. By taking into consideration the developed hydrological factors herein, they lead to the best possible balances. Further improvements should be aspired to in the area Lower Rhine and the gauge Lobith in the Netherlands. However, it needs to be noted that following the very complex interrelations, entirely contradiction-free data of water levels, discharges and balances will never be achieved and that small blurs will remain.